Figures and Infographics for Penn State College of Medicine
In my 5 years at Penn State College of Medicine much of my effort has gone to create a number of figures and infographics, as aids to explain complex scientific ideas in a visual format.
To be successful: we established professional graphic styles that would align with the larger Penn State brand and be accessible for non-academic audiences.
These graphics were used both in formal grant writing and in public messages to explain research to the community.
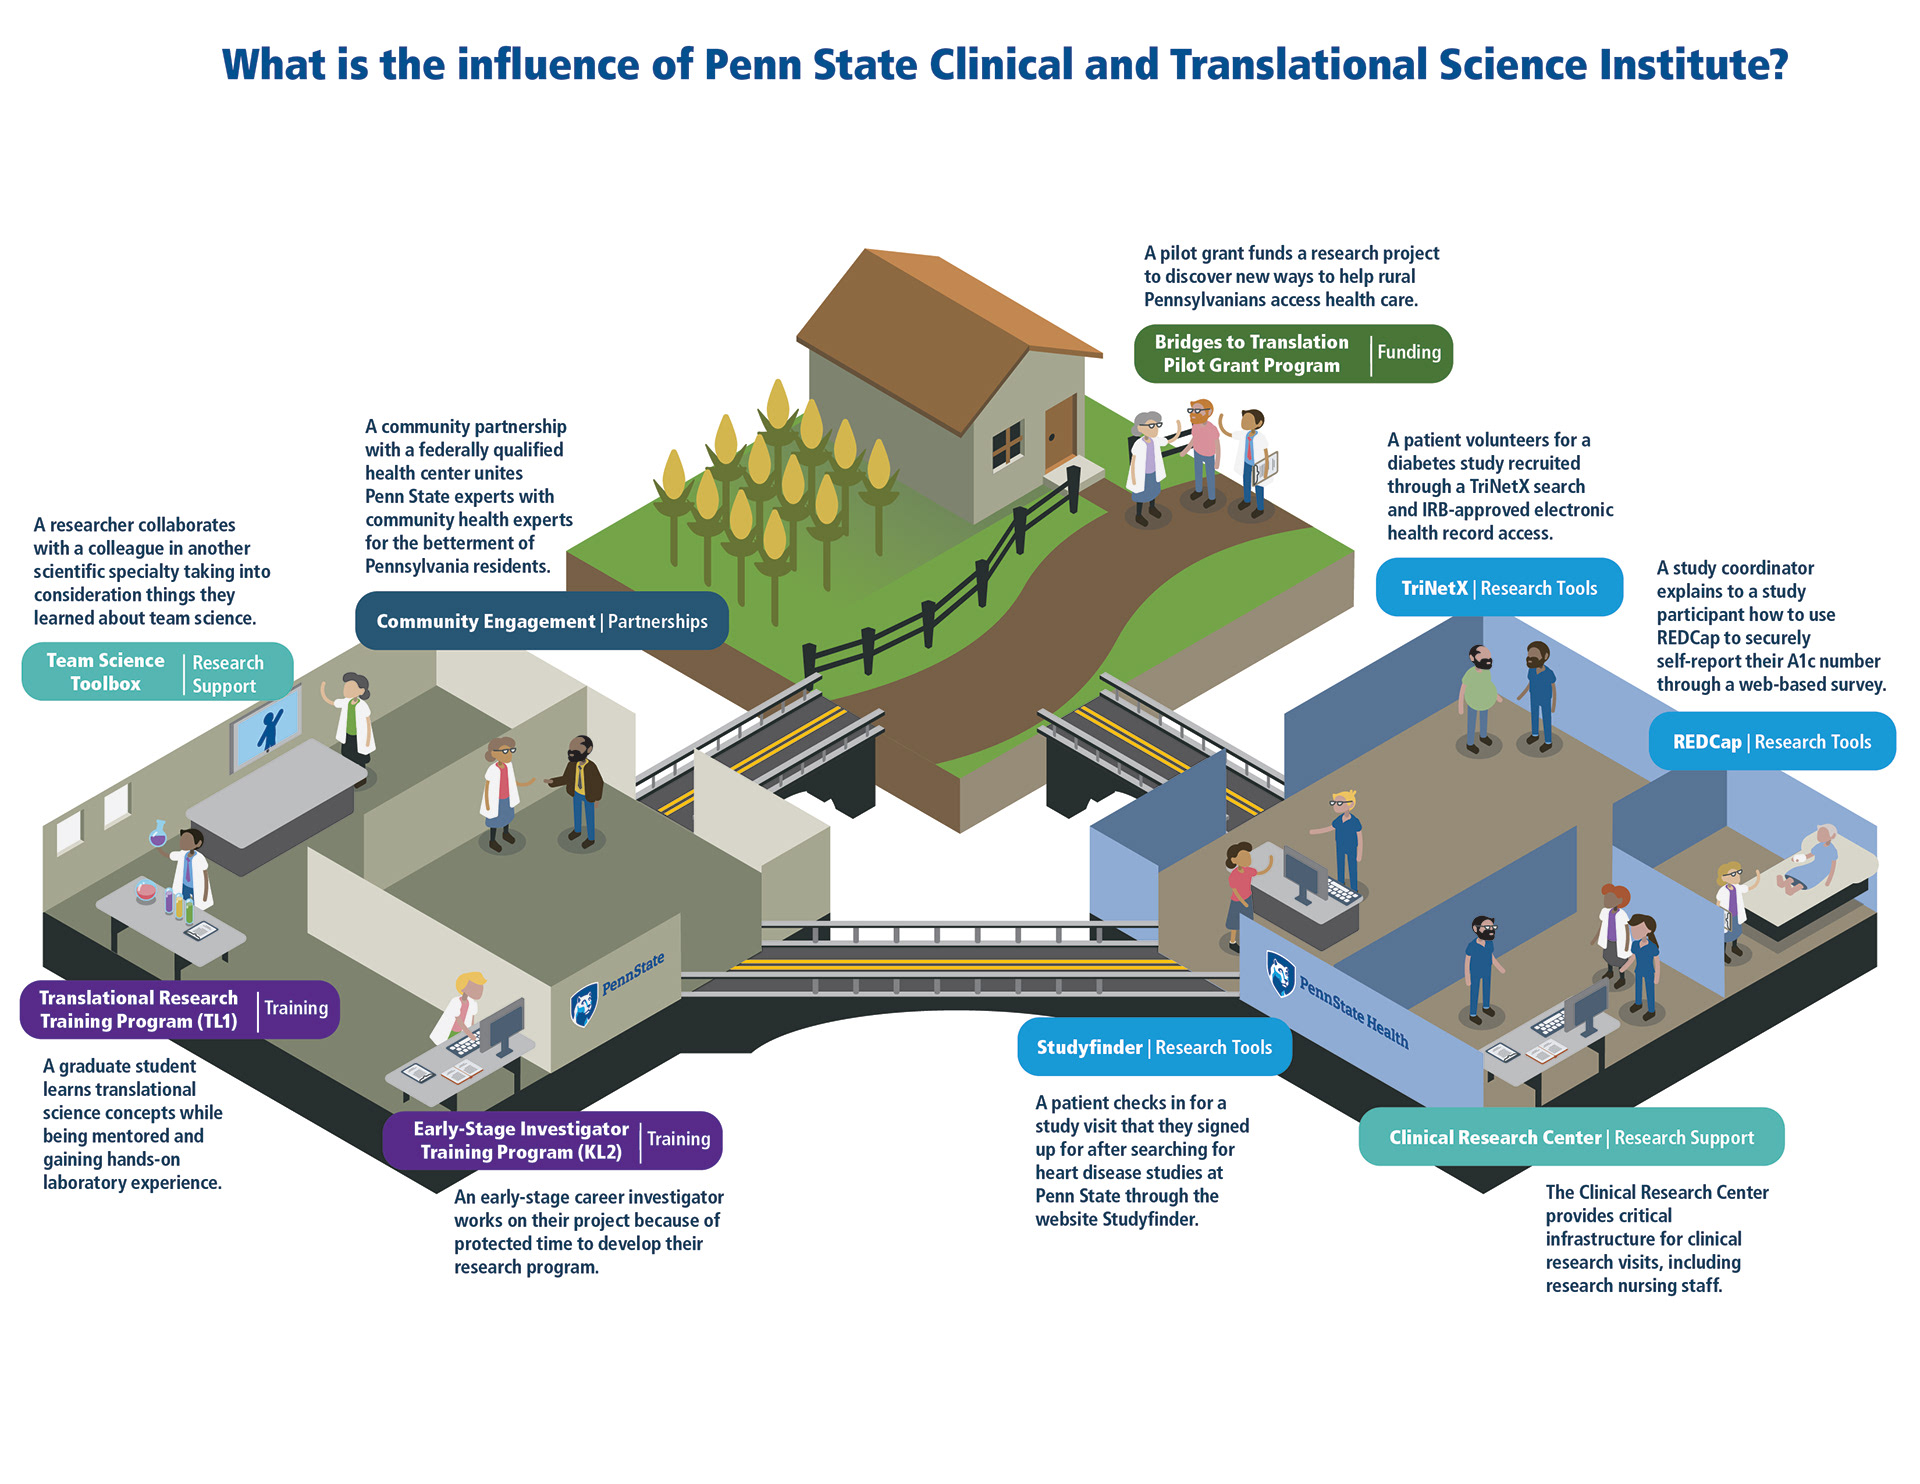
The figure above illustrates the multi-faceted network that a Clinical and Translational Science Institute (CTSI), and specifically how the Penn State CTSI impacts traditional and clinical science to benefit patients and communities.
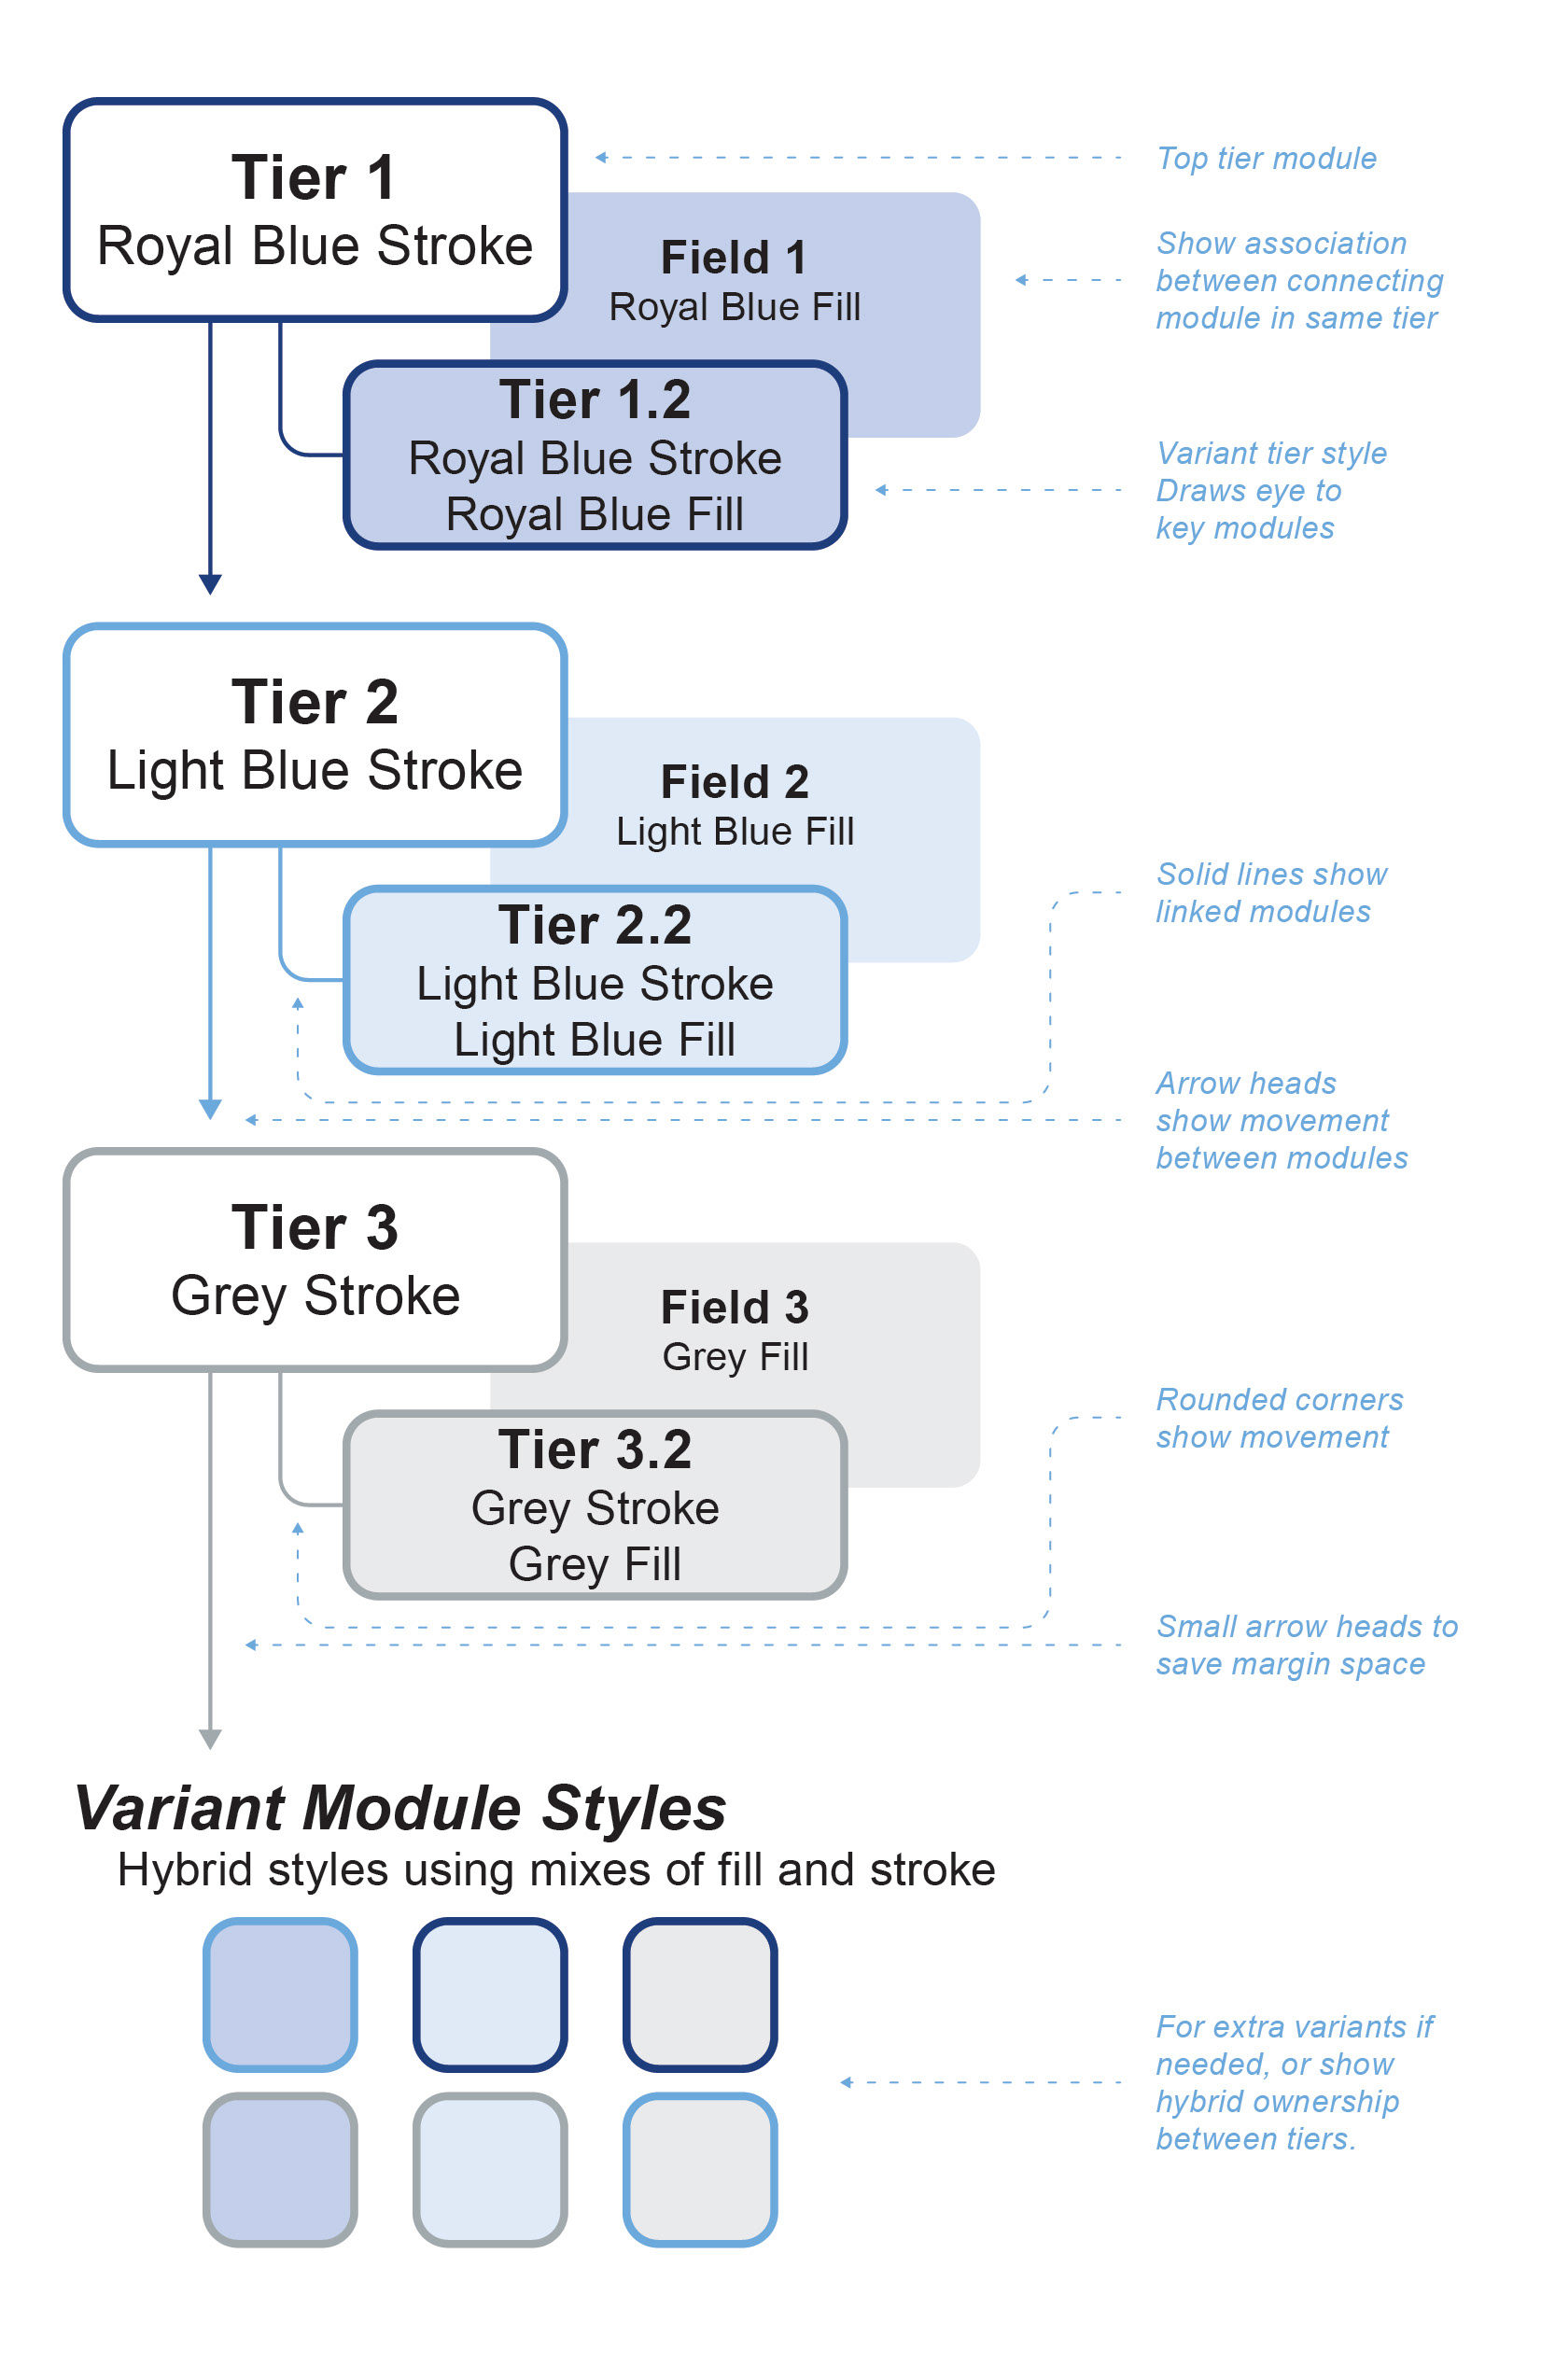
New style guide for grant figures
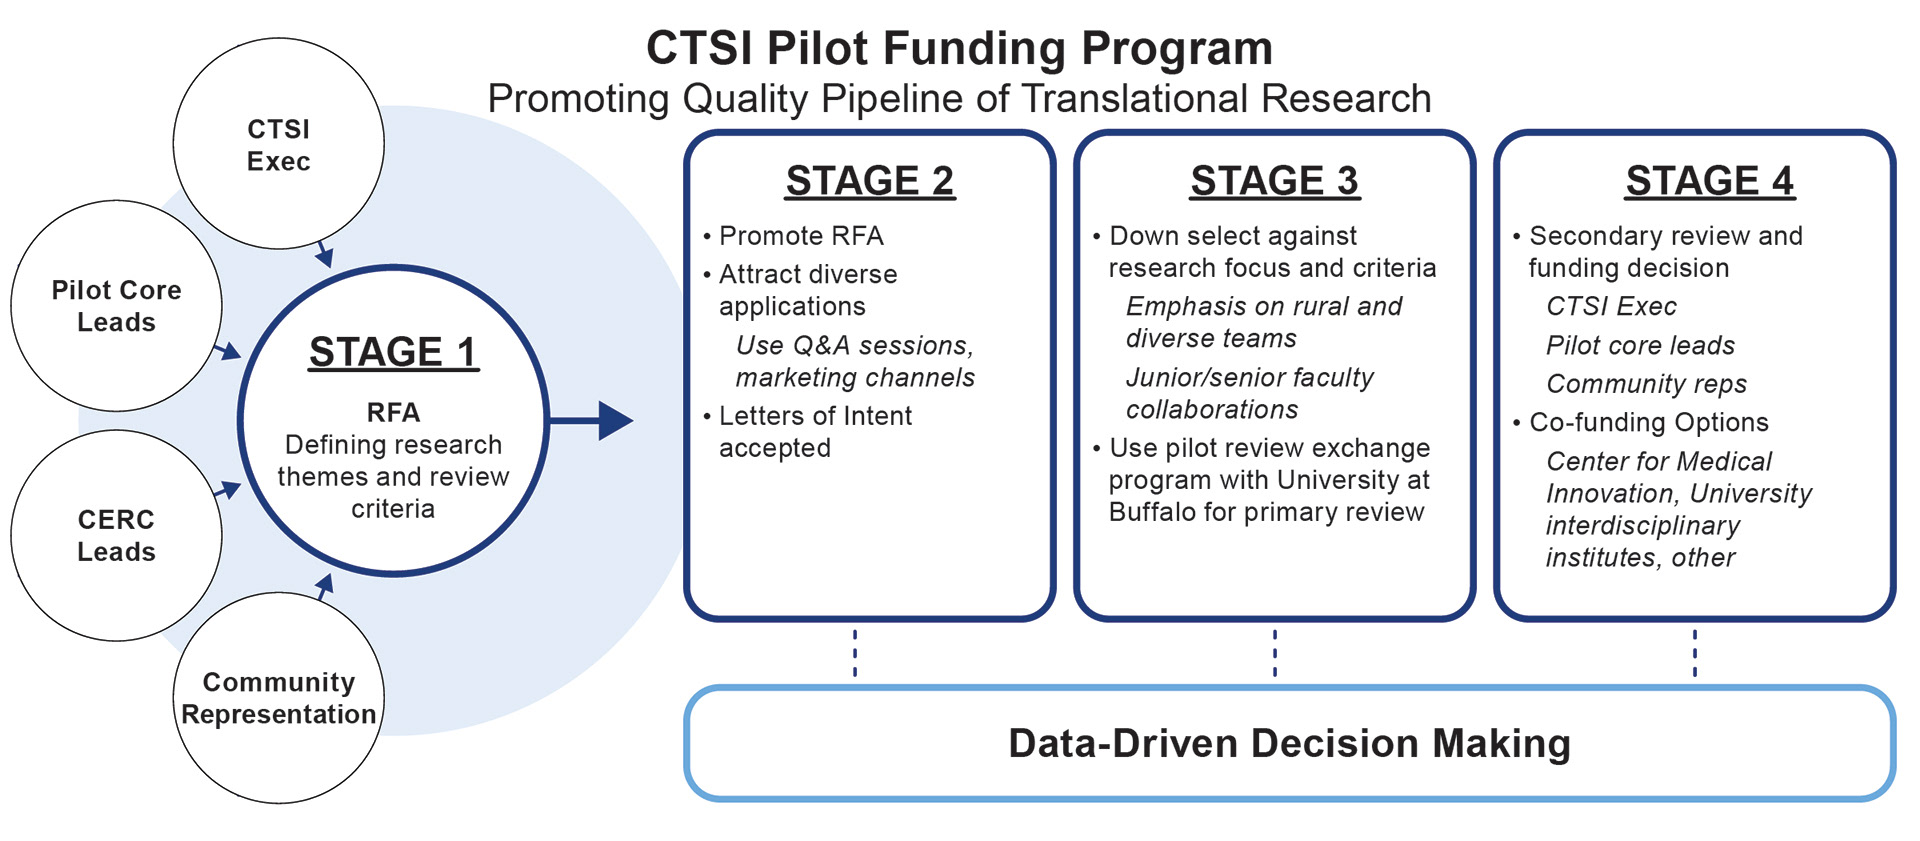
Pilot funding program
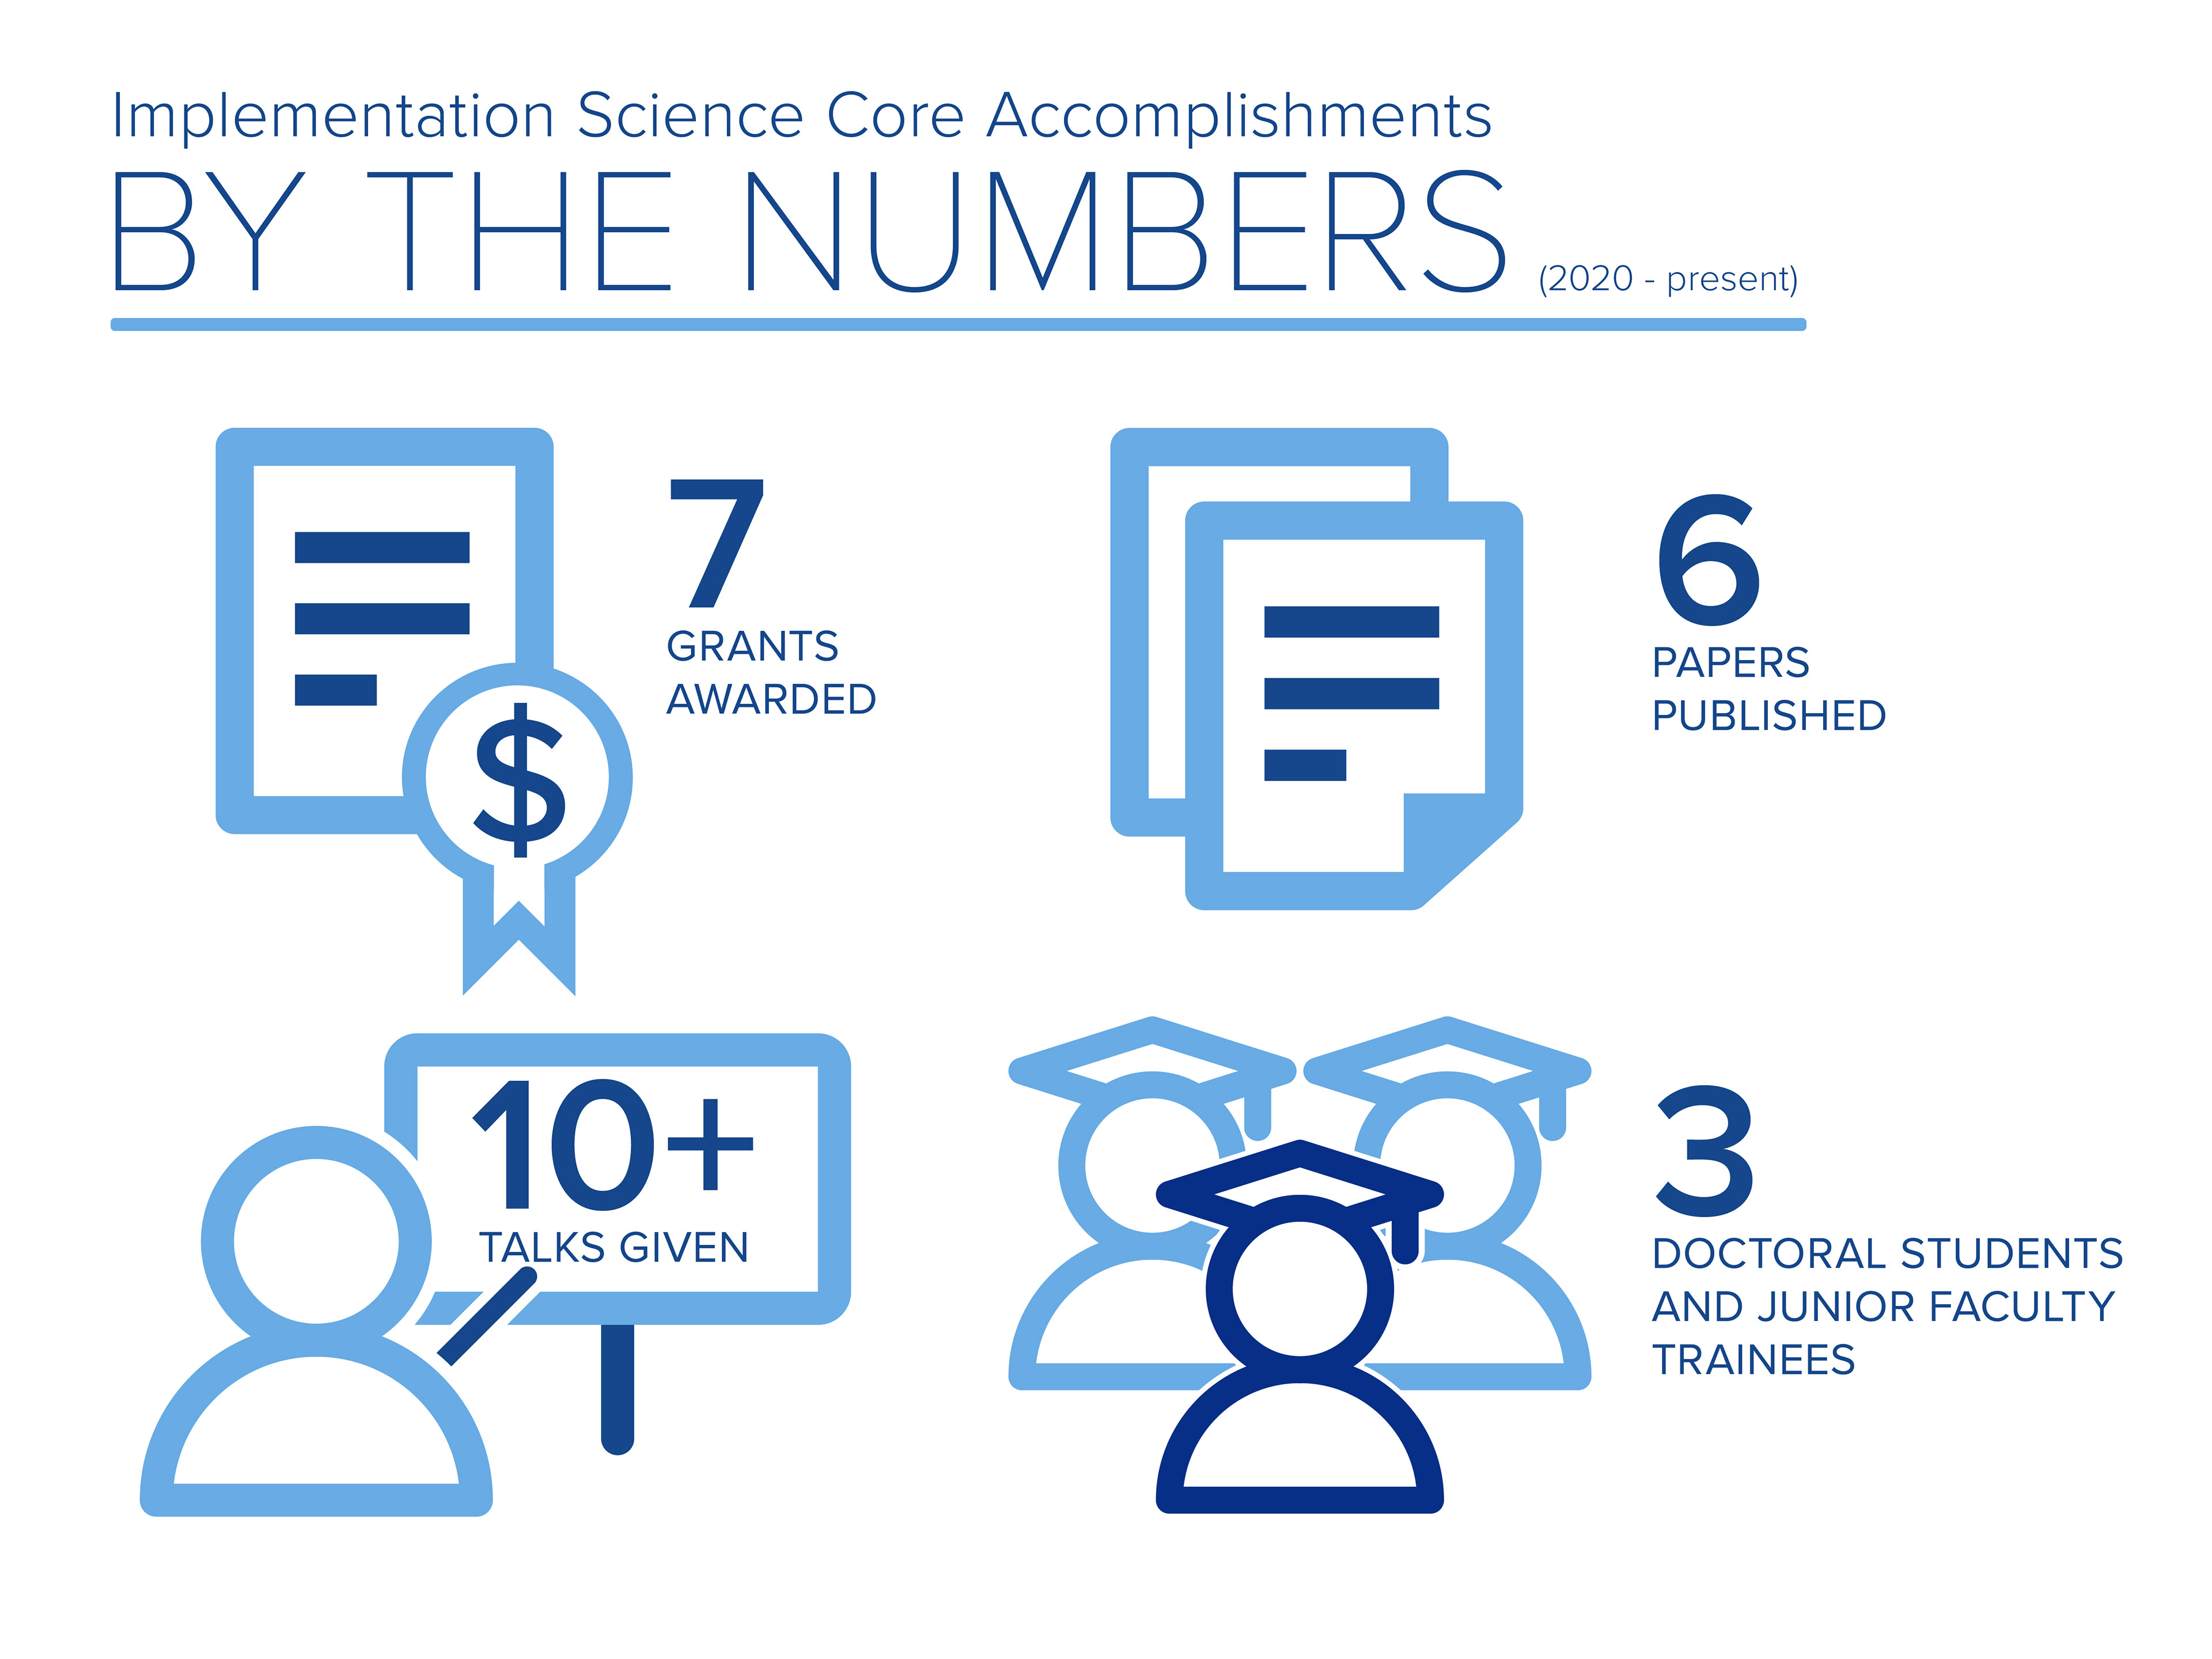
ISC By the Numbers
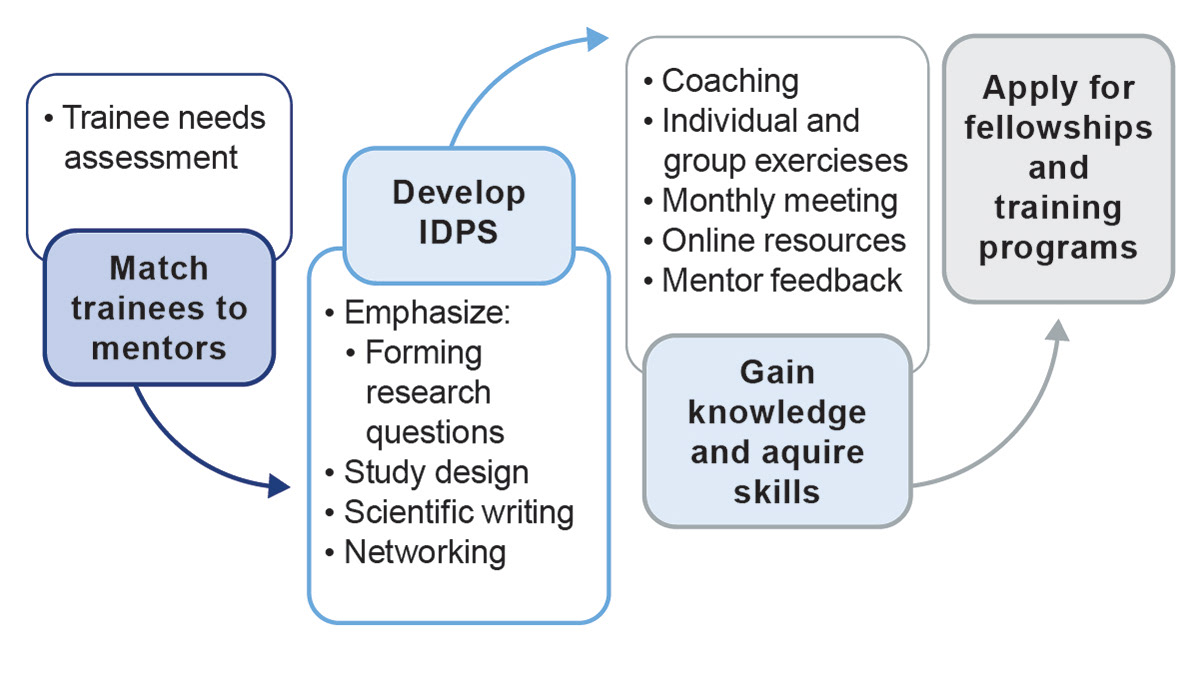
Fellowships and mentorship process guide
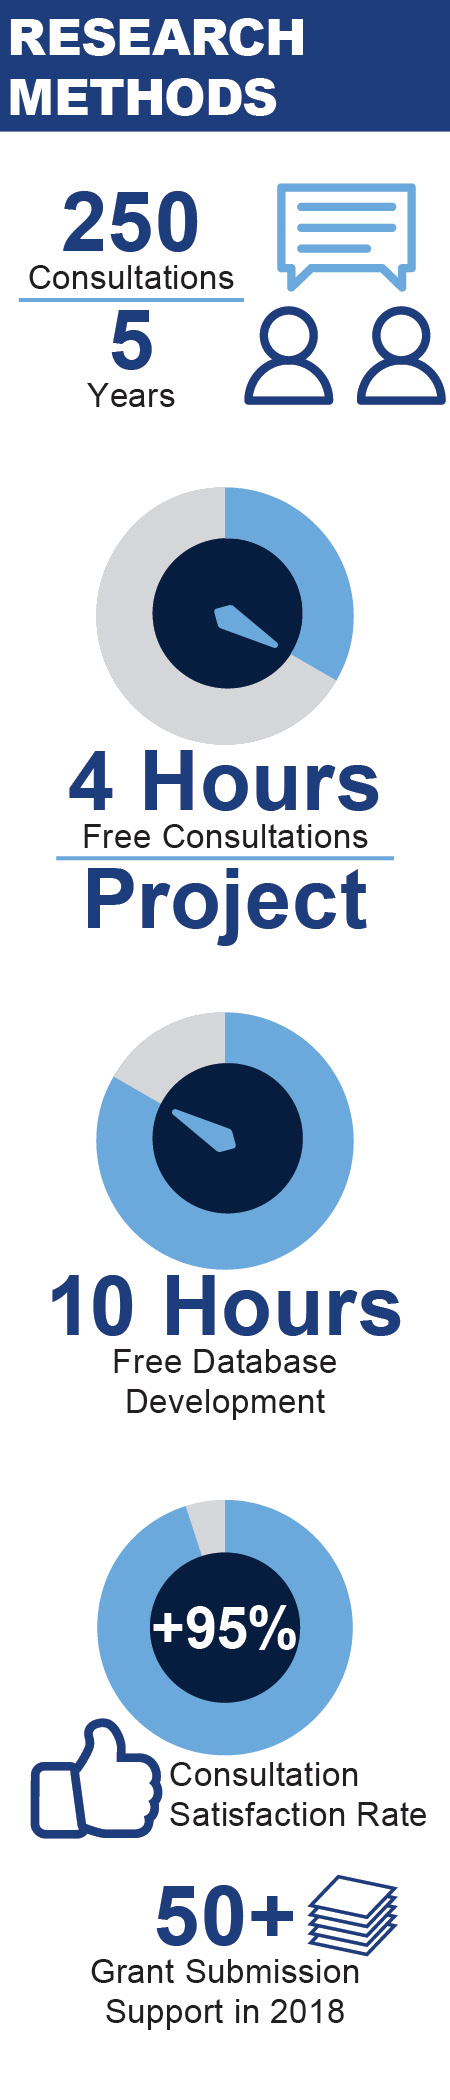
Research methods by the numbers
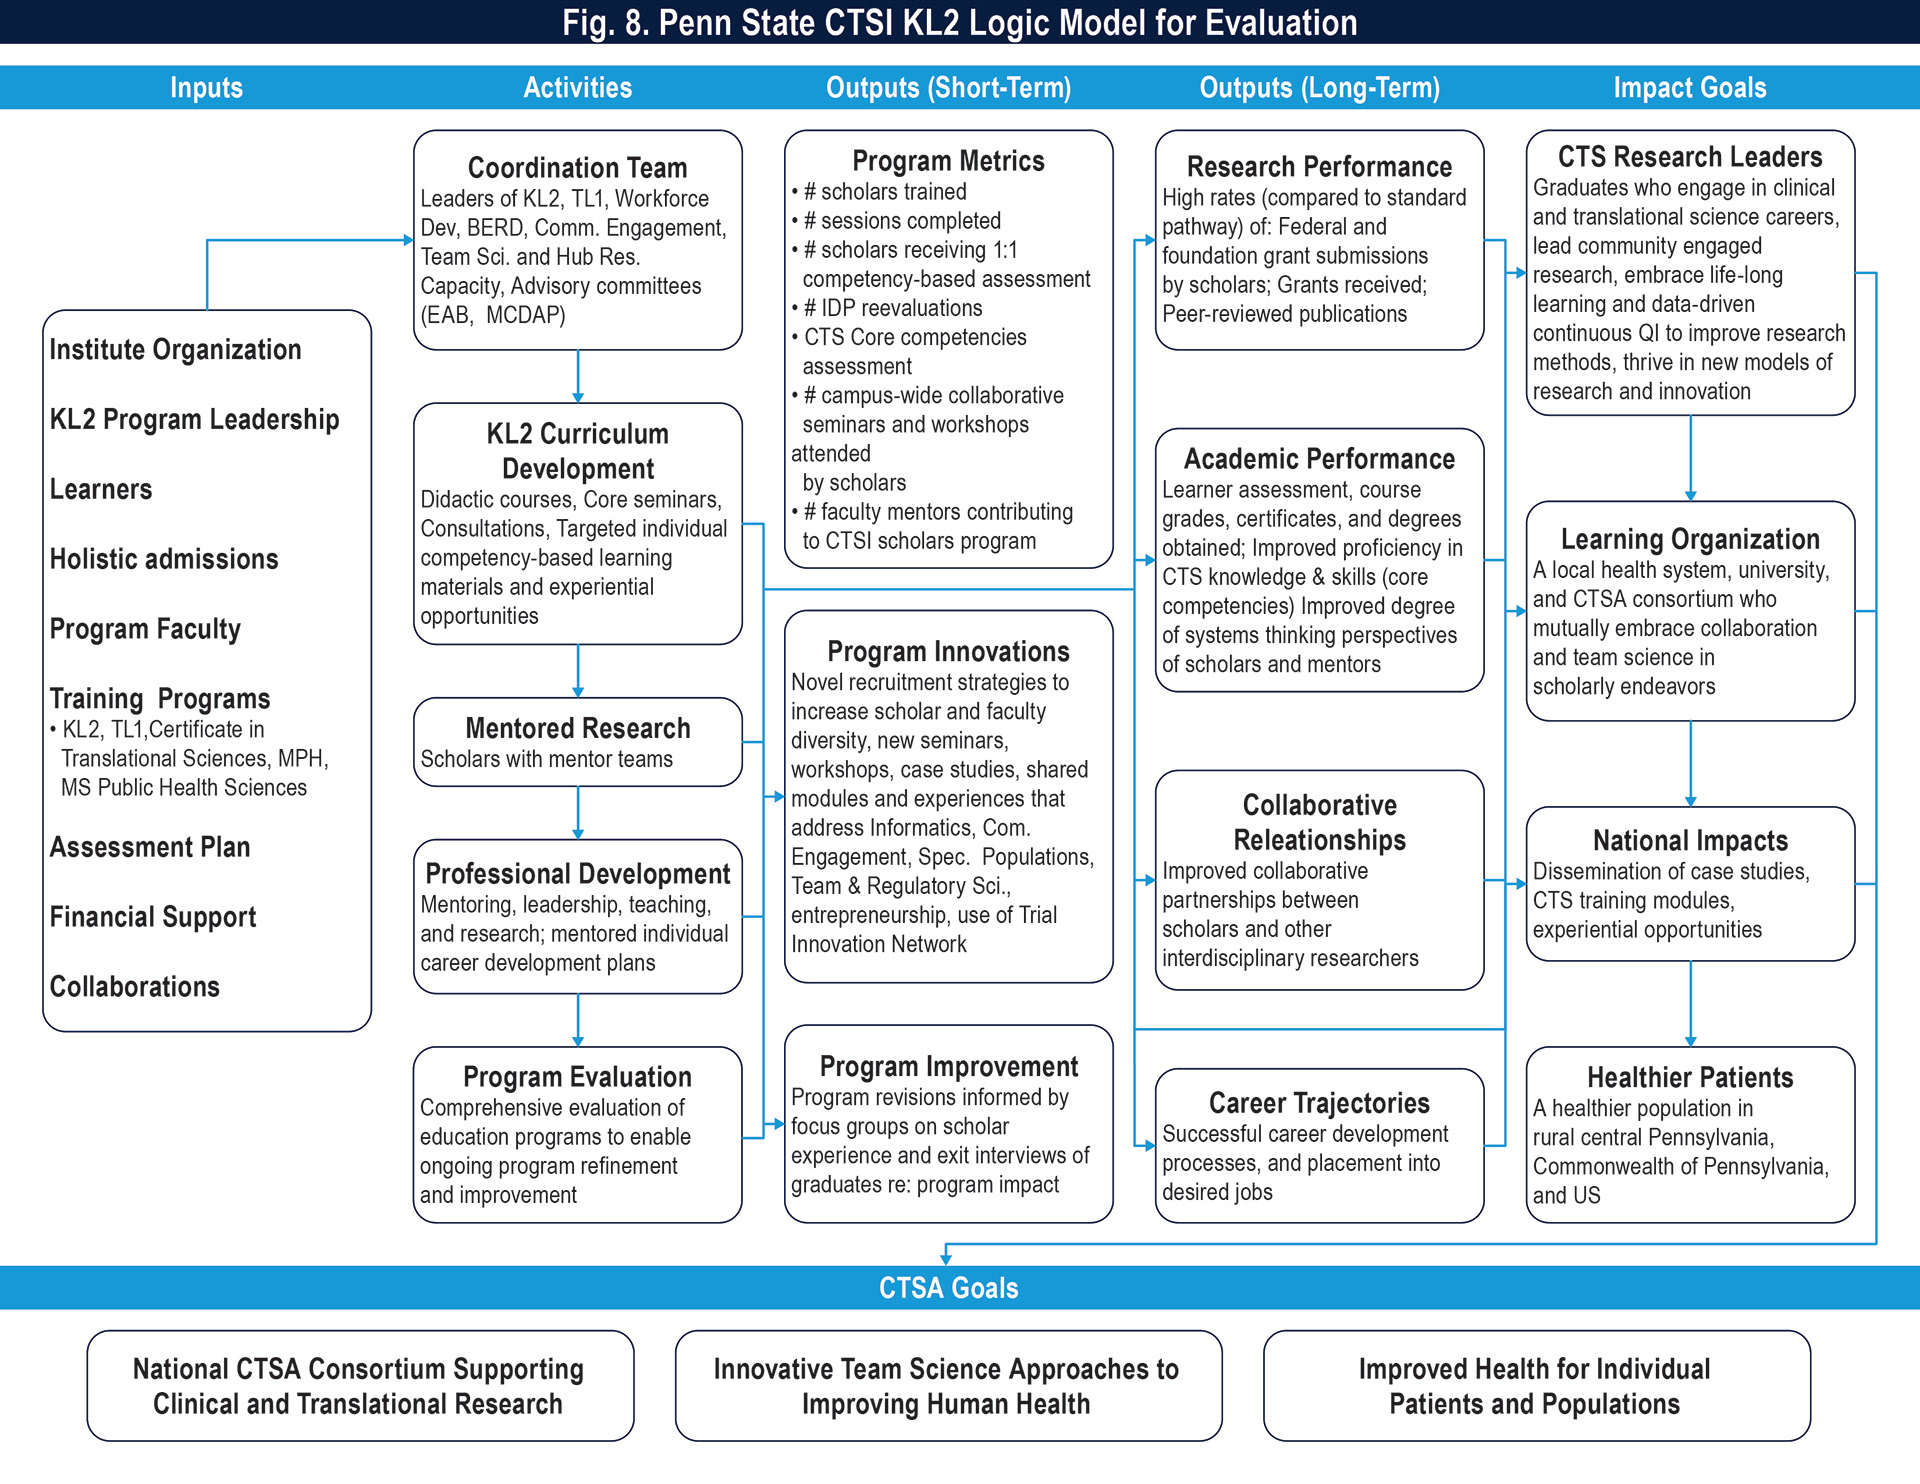
Logic Model
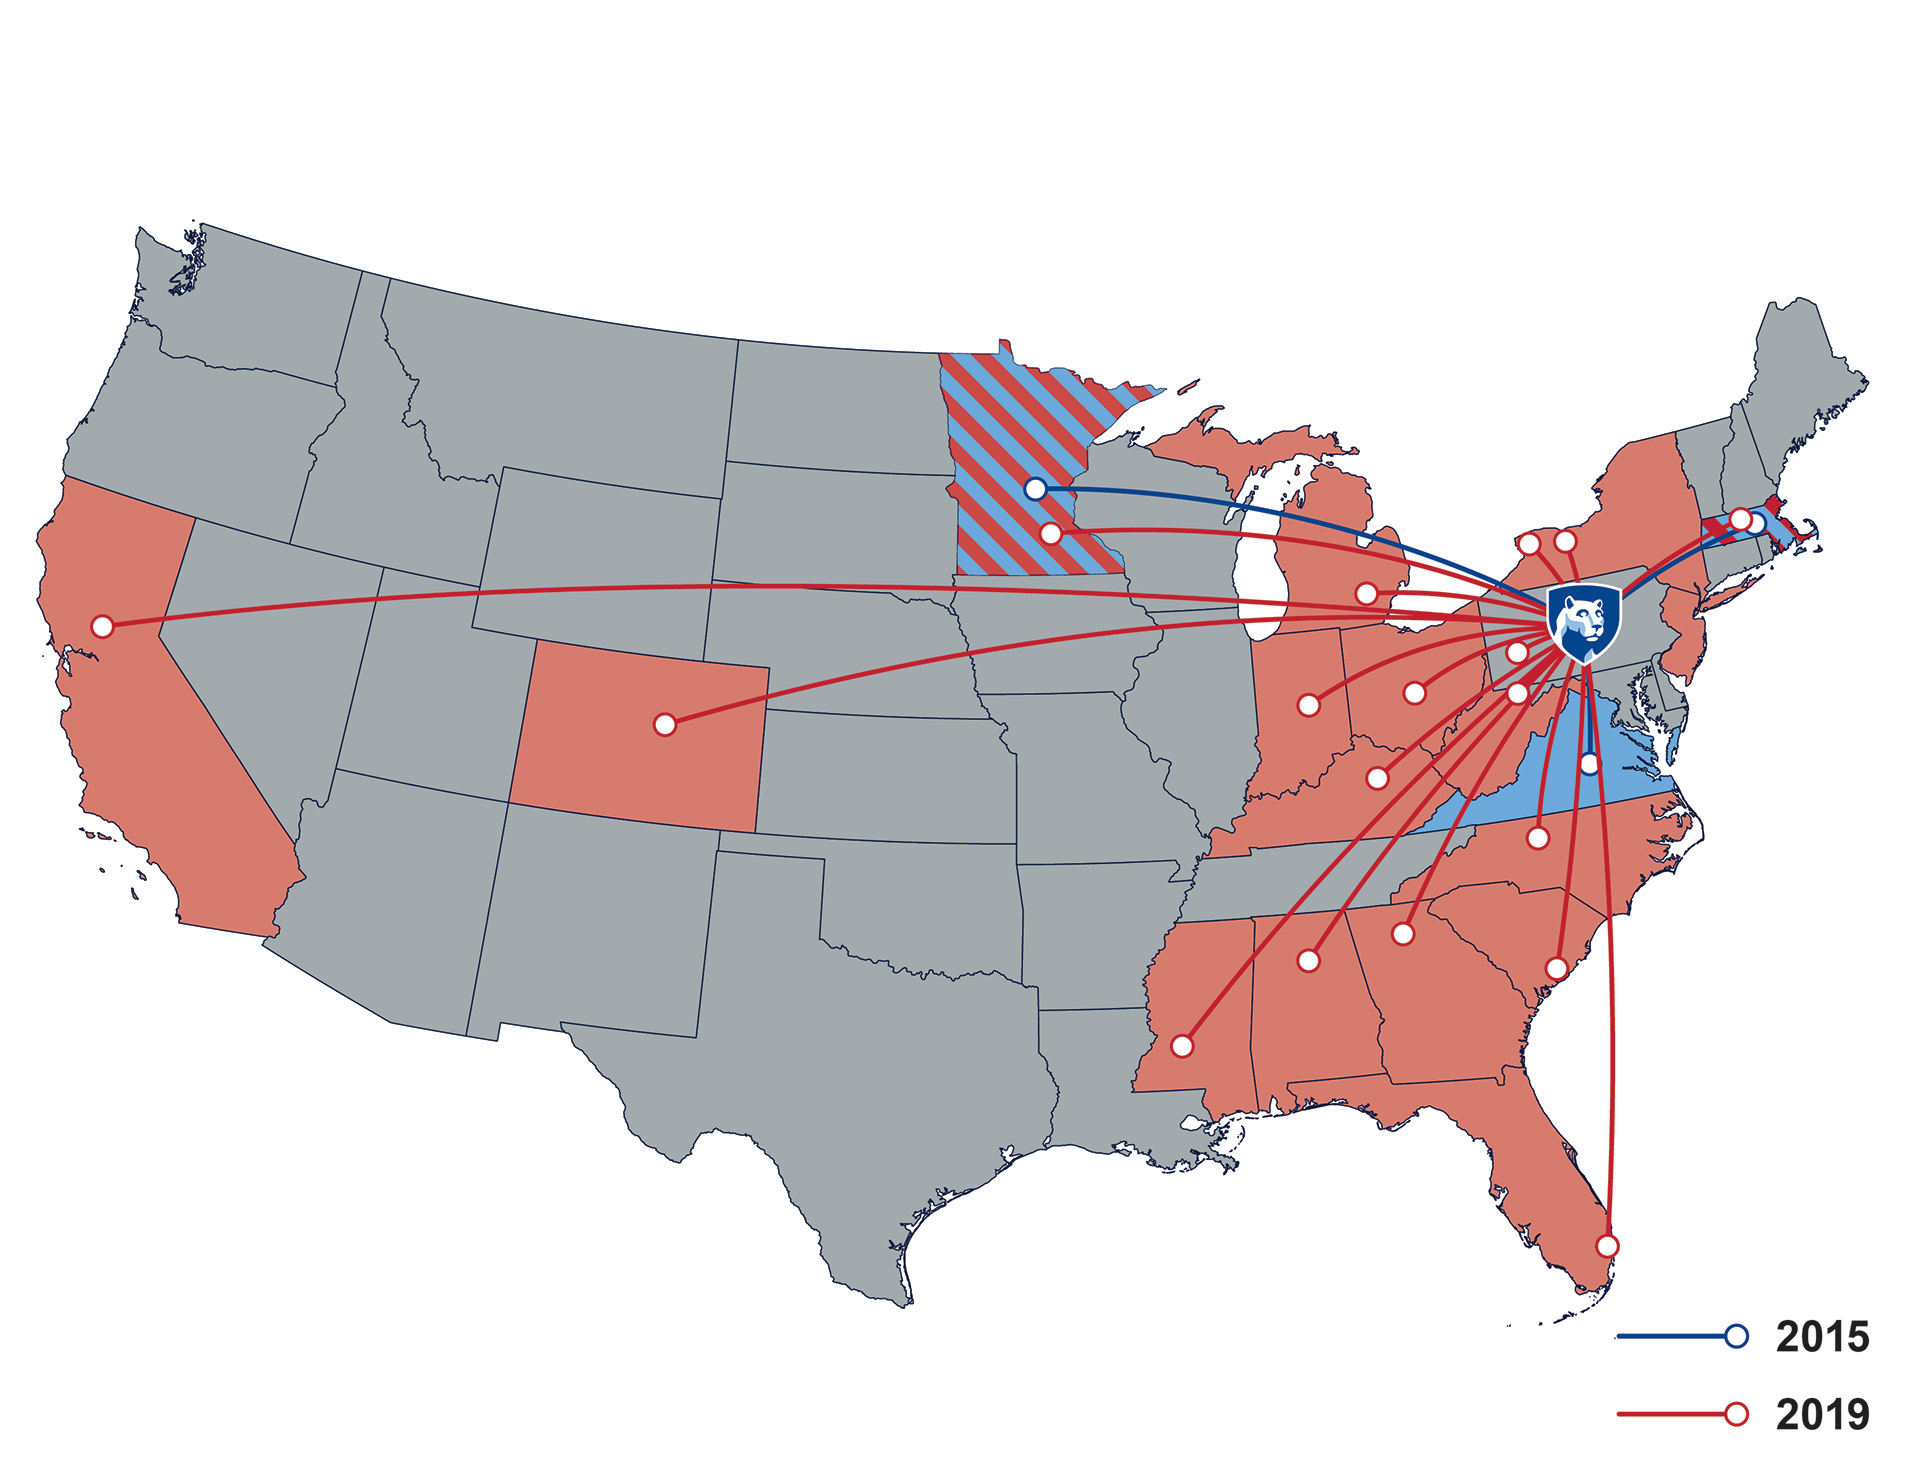
Collaborators map
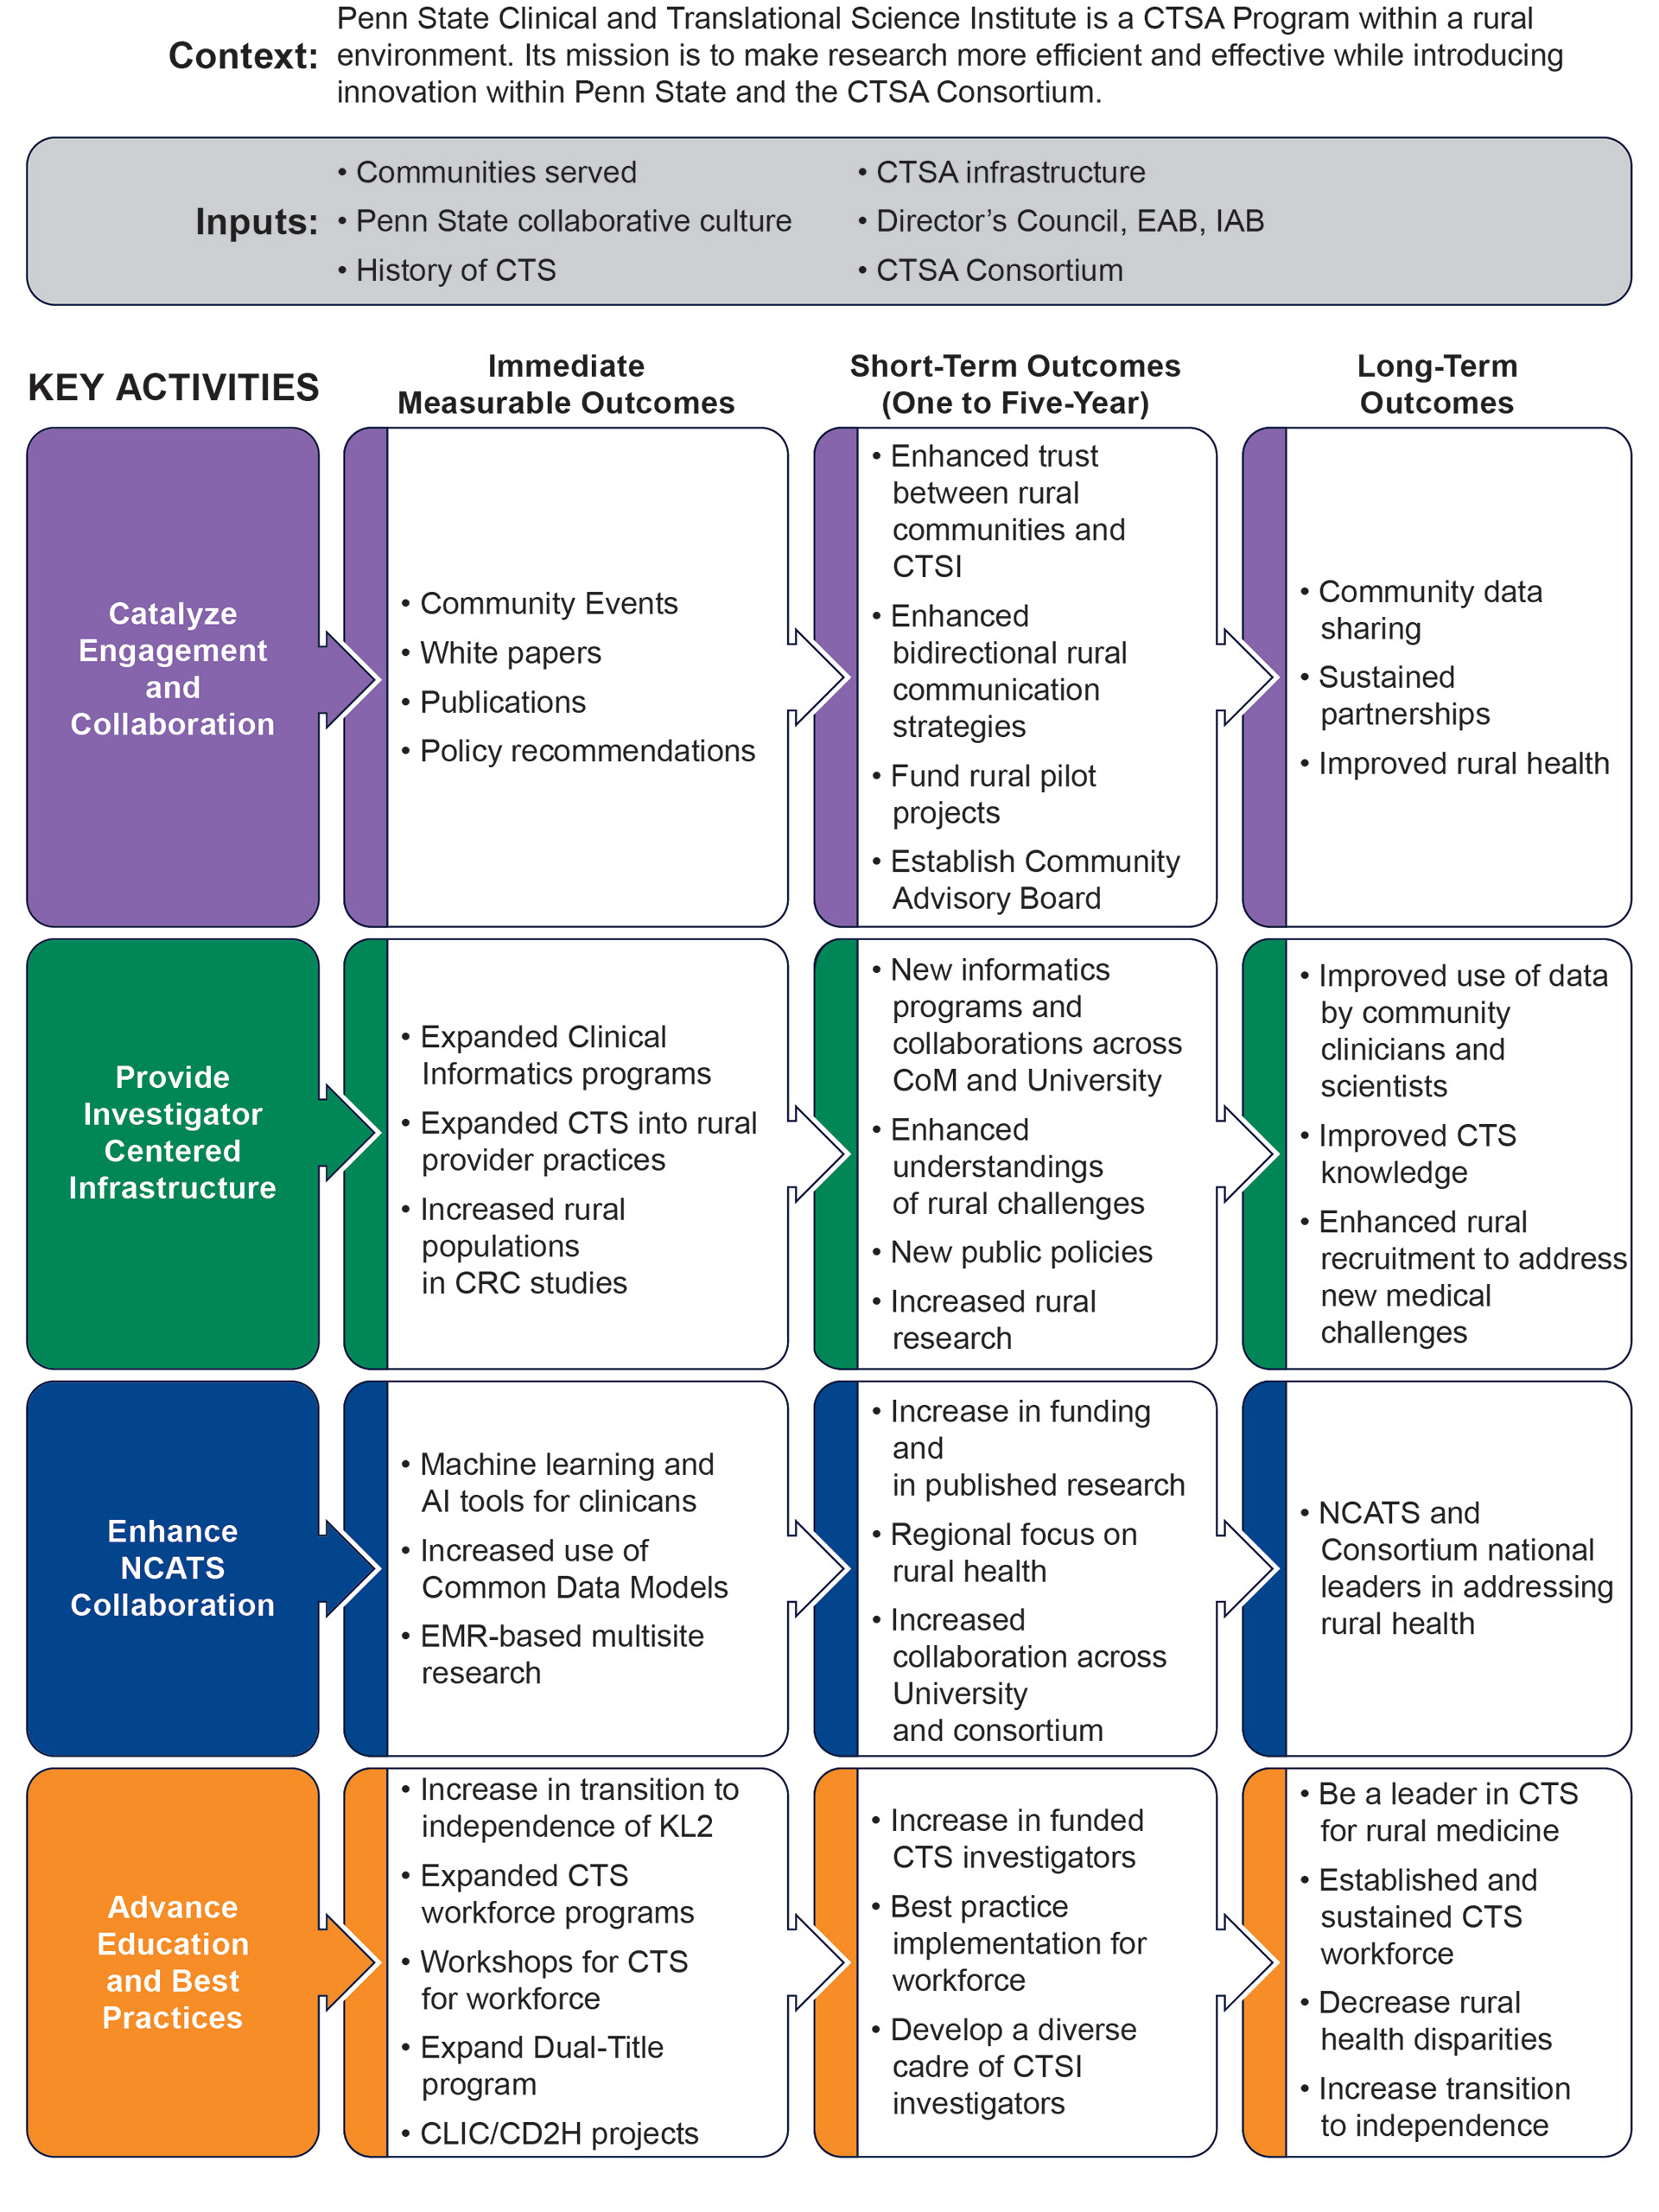
logic model

"Bridge of Semantic Despair"
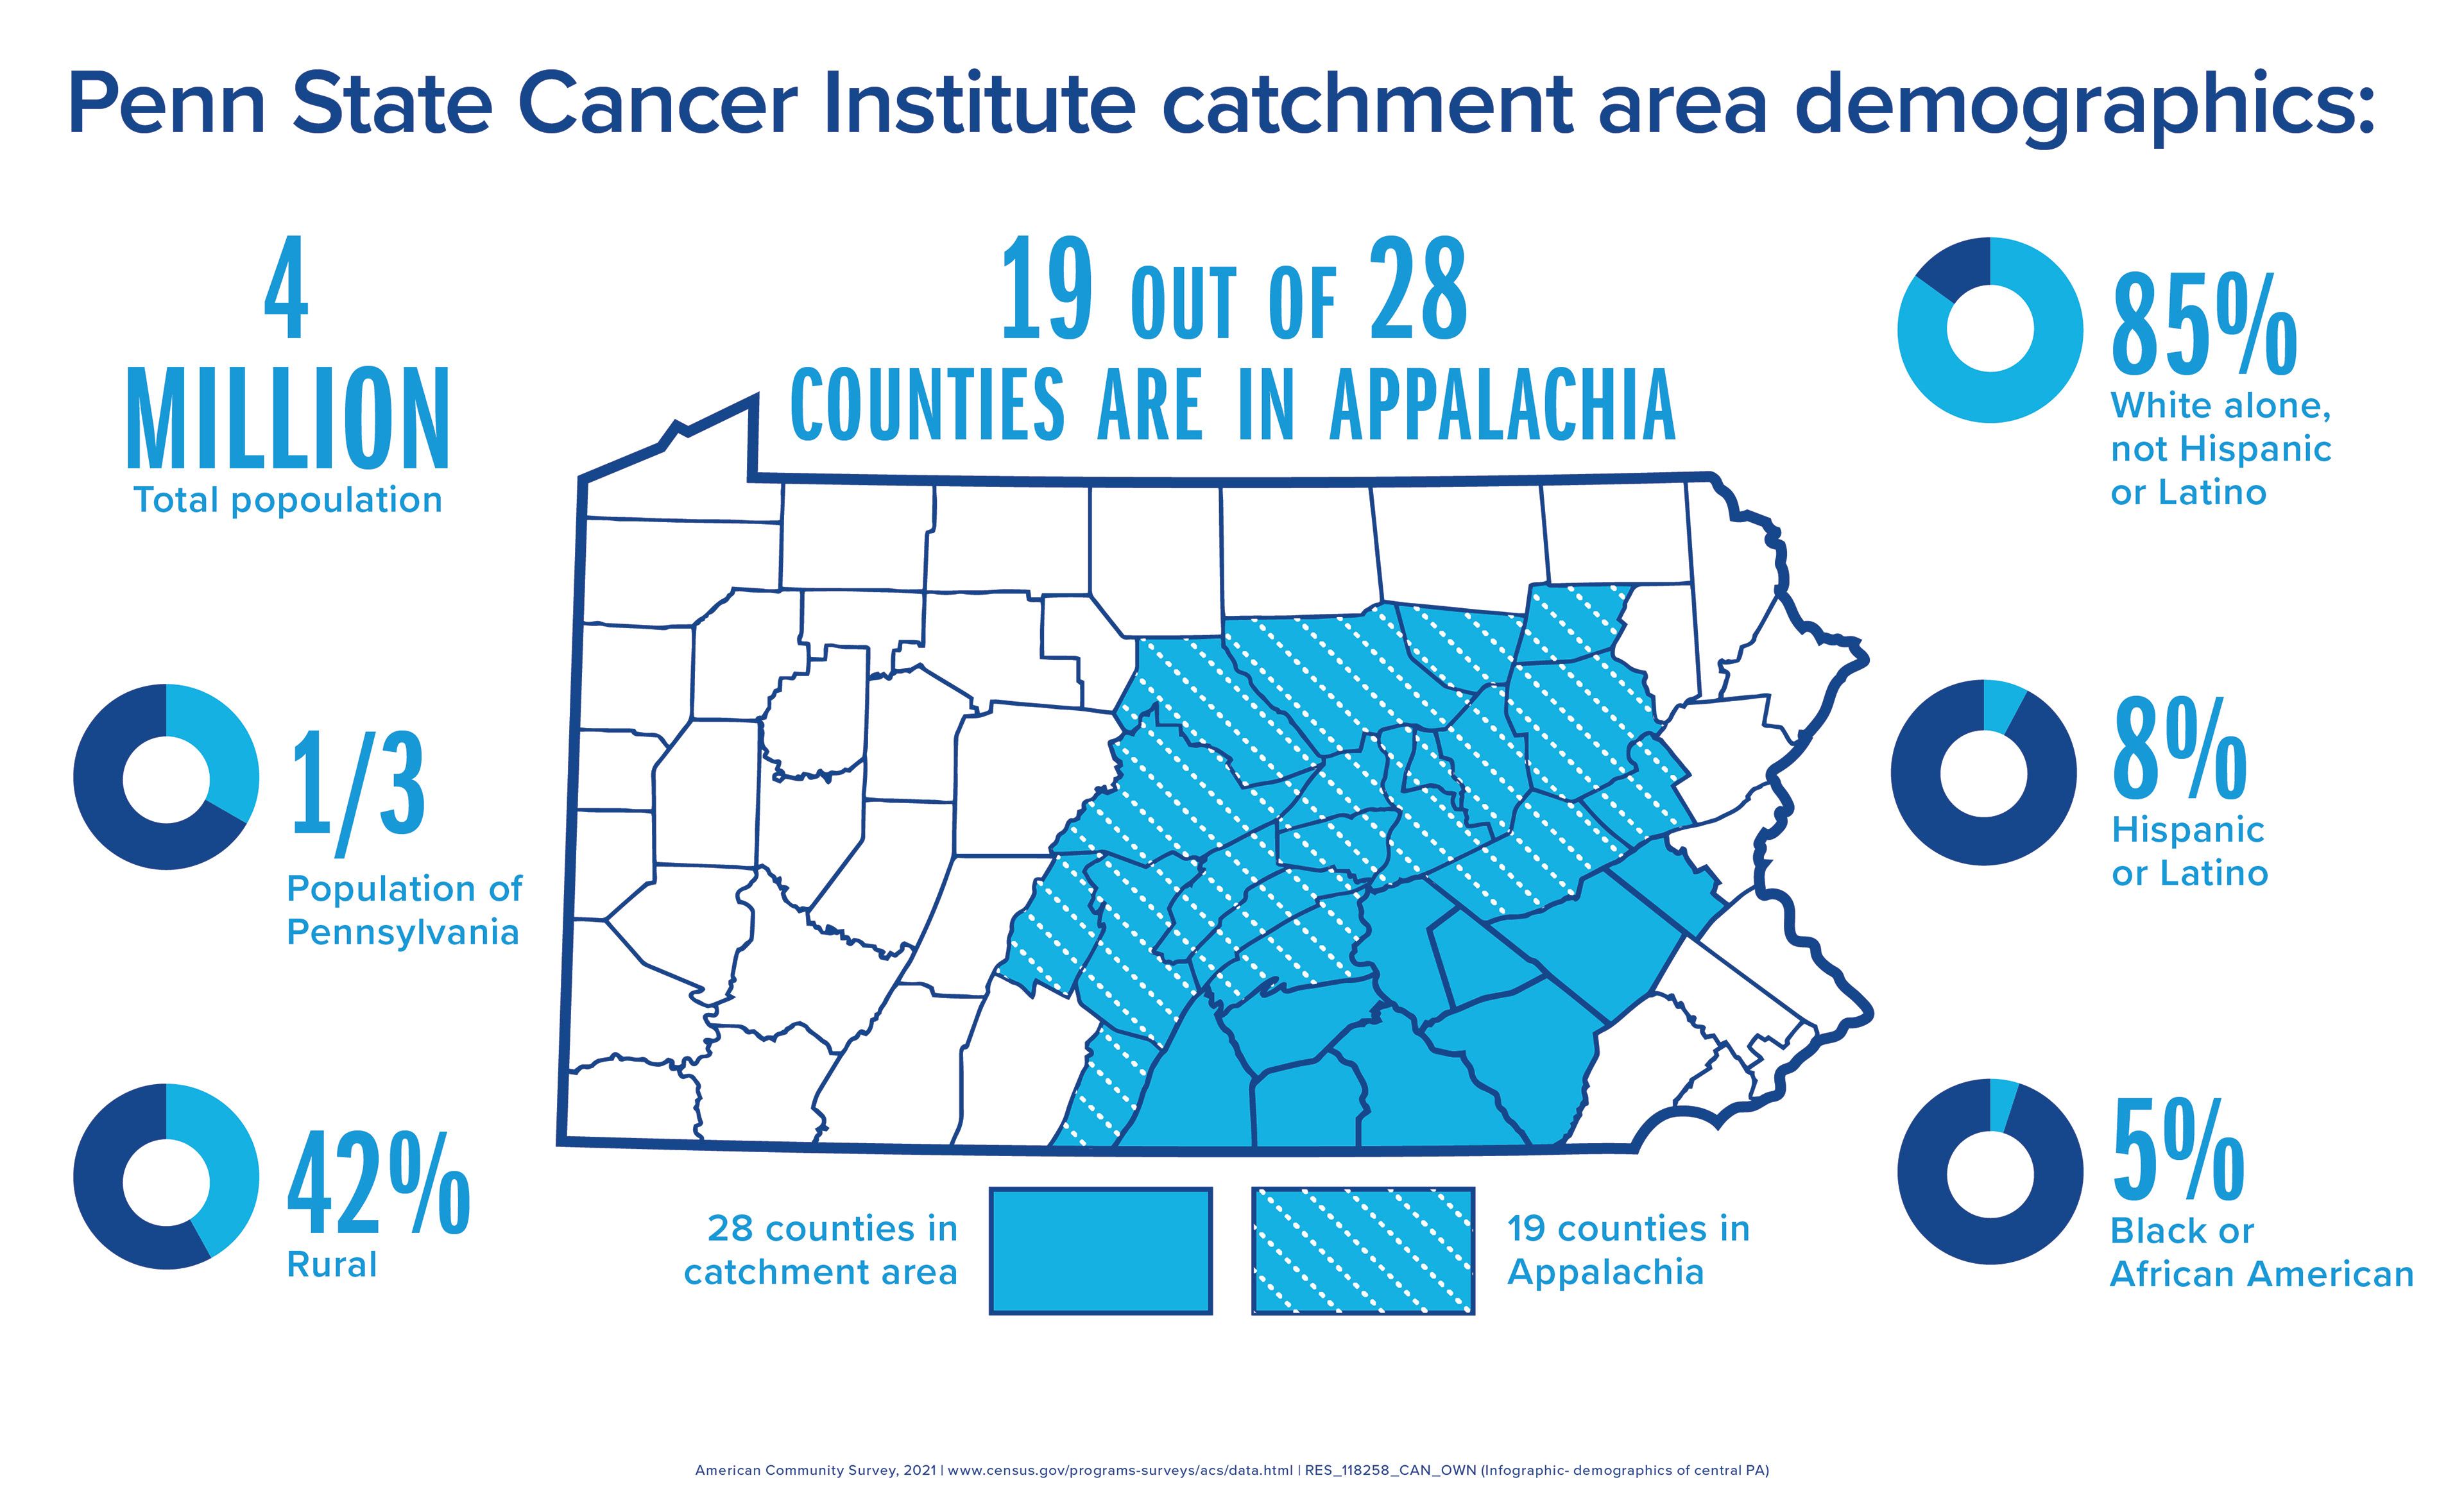
Cancer Institute catchment area demographics
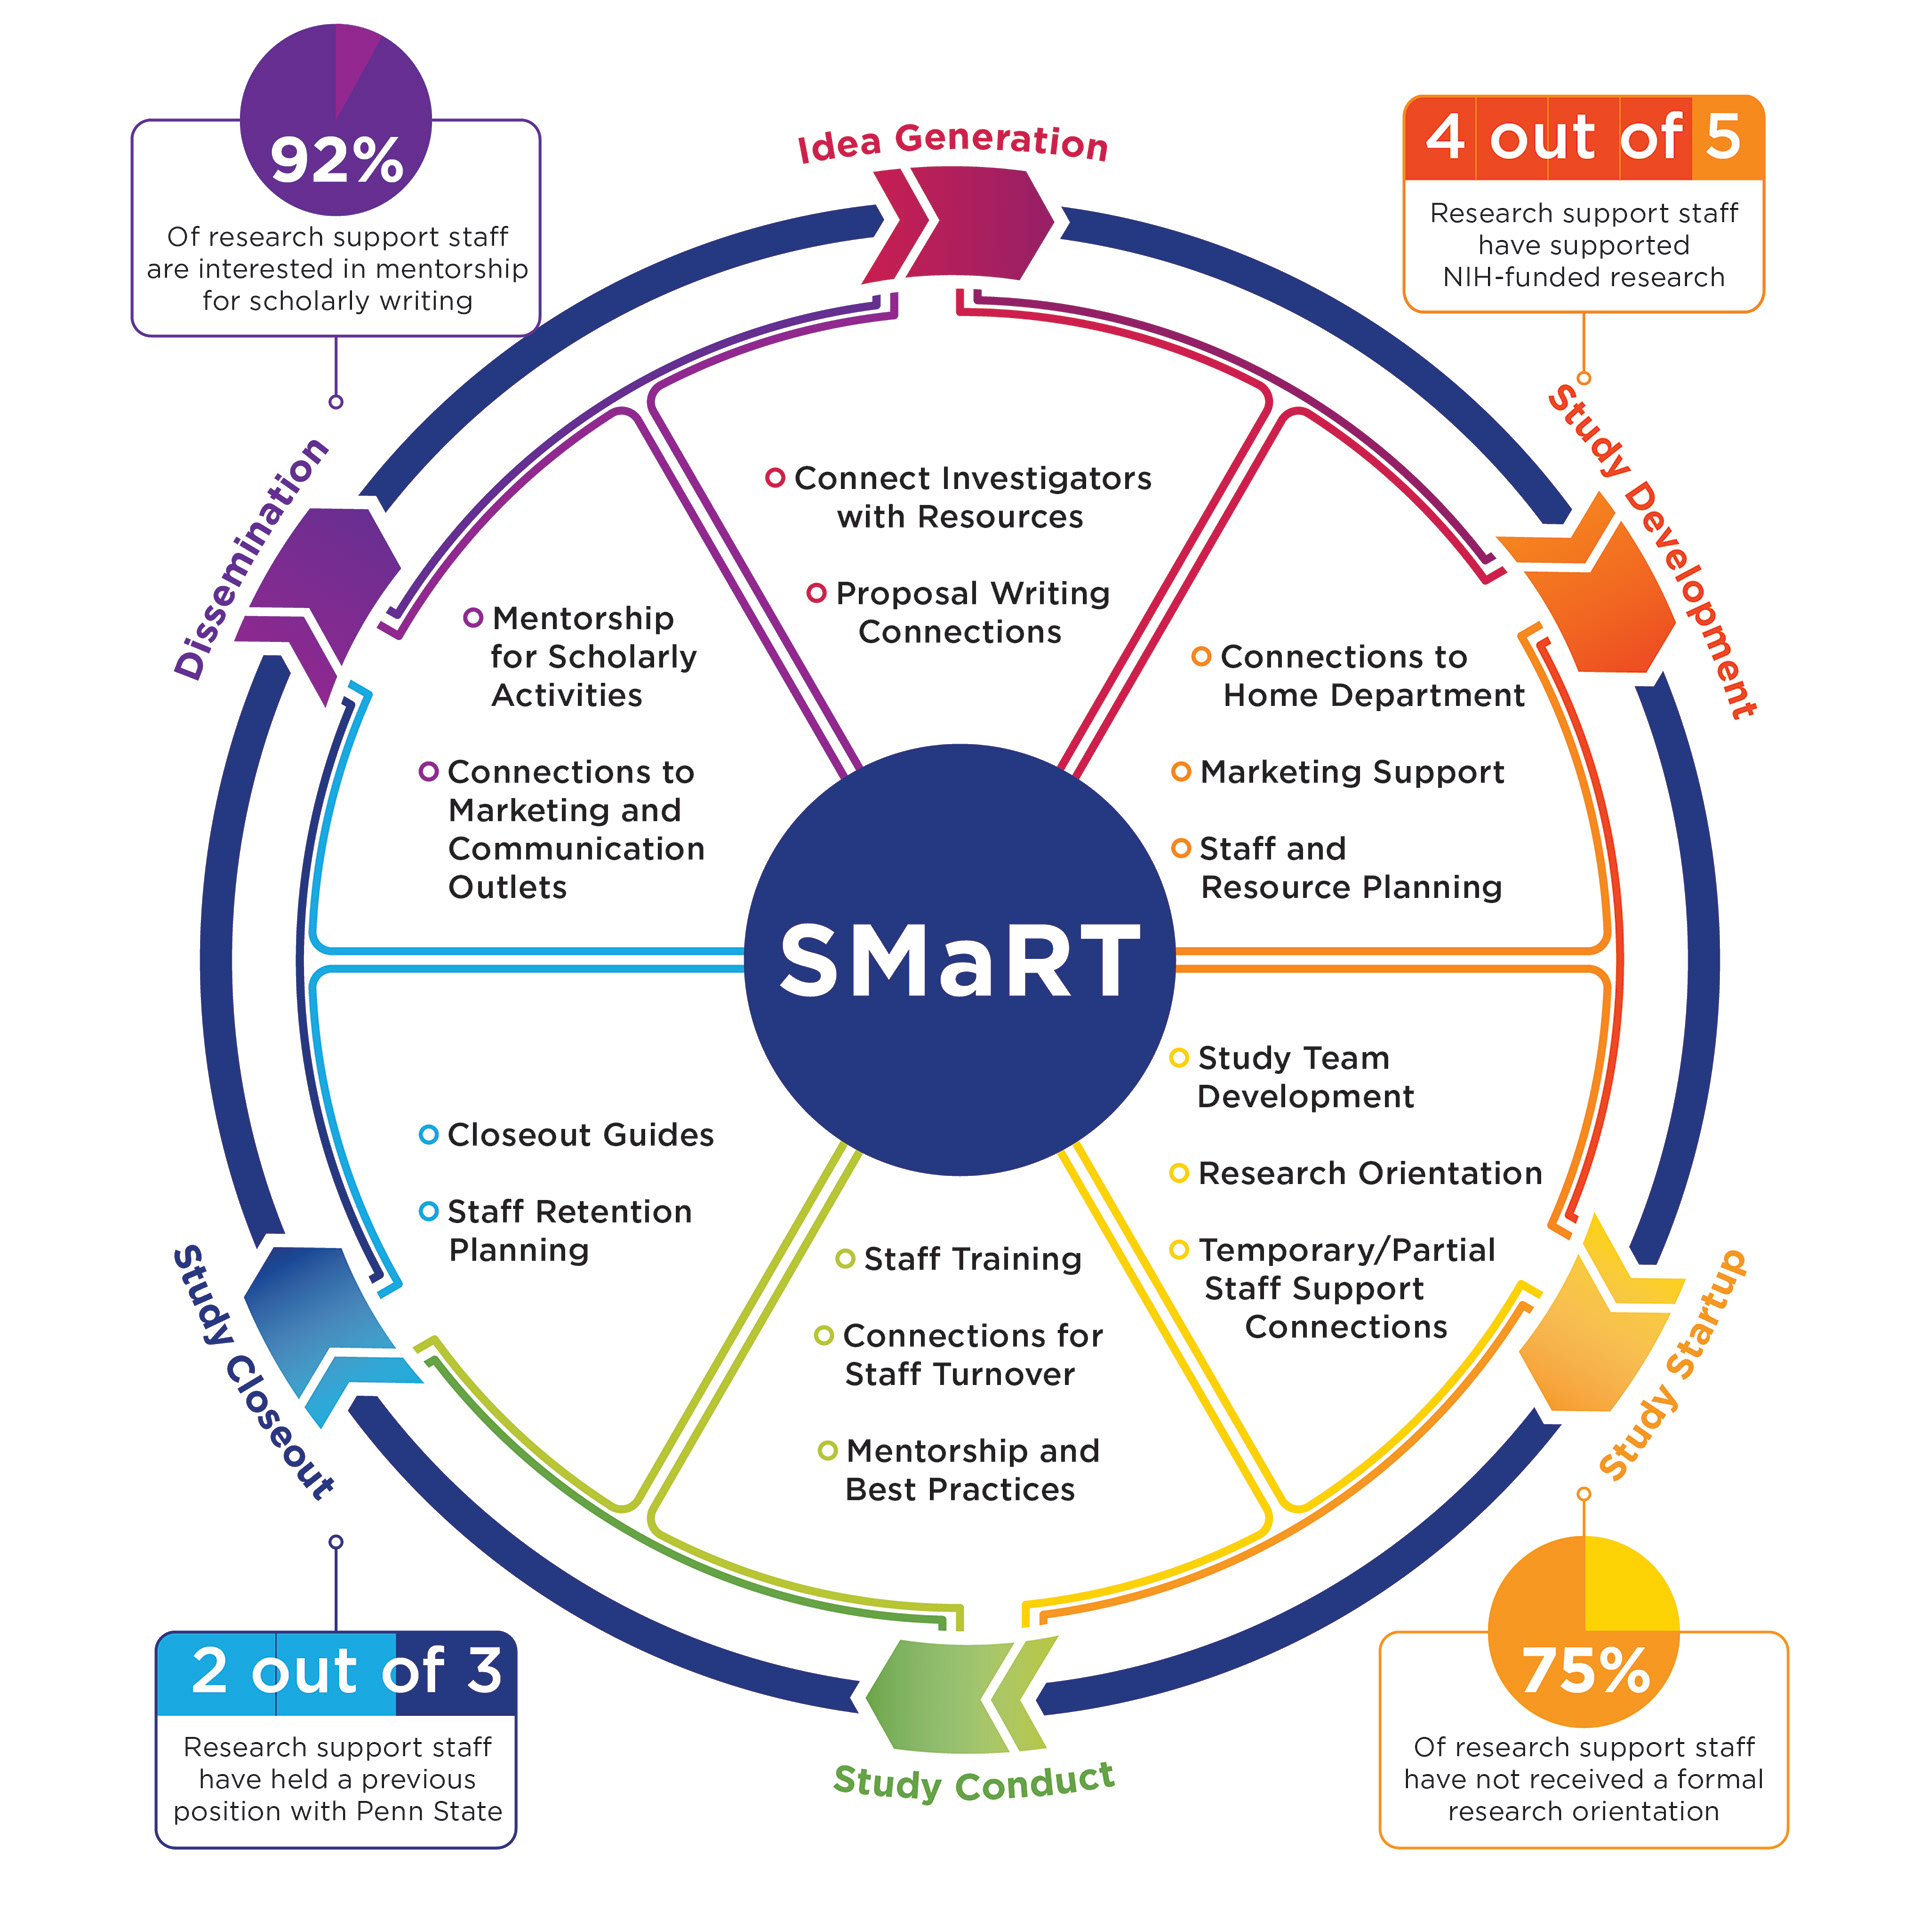
SMaRT program infographic